Physical Inventory Count in Microsoft Dynamics NAV 2015
What I want to show you guys today is the Physical Inventory Journal – how we do physical inventory. Basically I’ve been told that we have inventory of coffee mugs in two locations, and I really want people to do an inventory check in those locations for how many we have.
View Item Availability
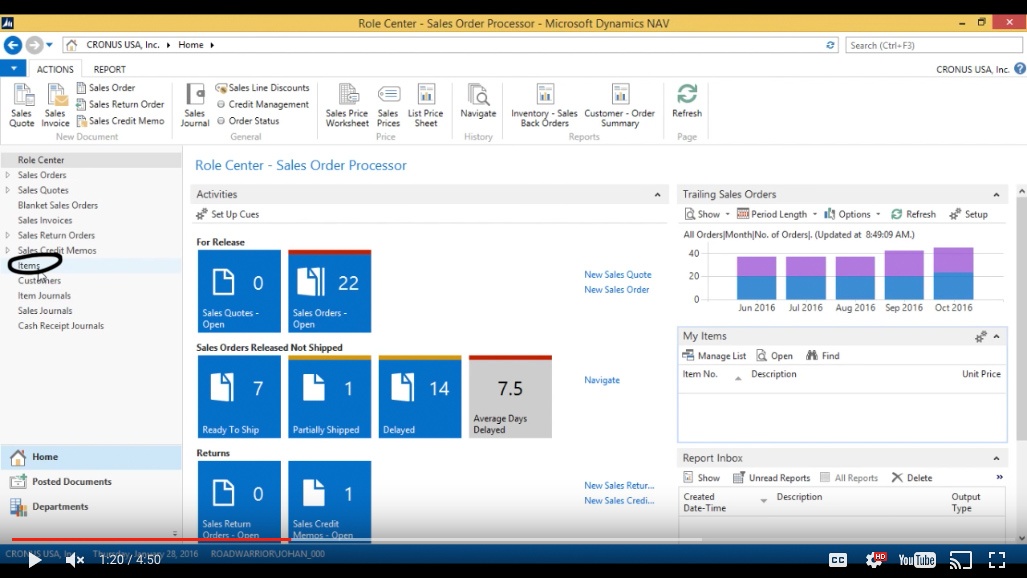
So, if I go right in here and look at my item.
(Click image to view larger version)
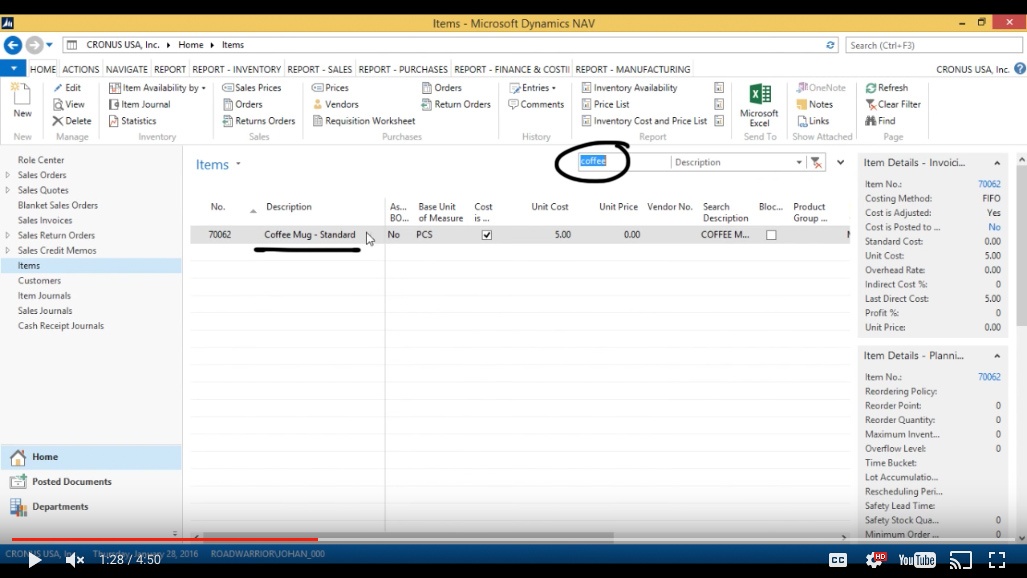
Then take a look at the coffee mug.
(Click image to view larger version)
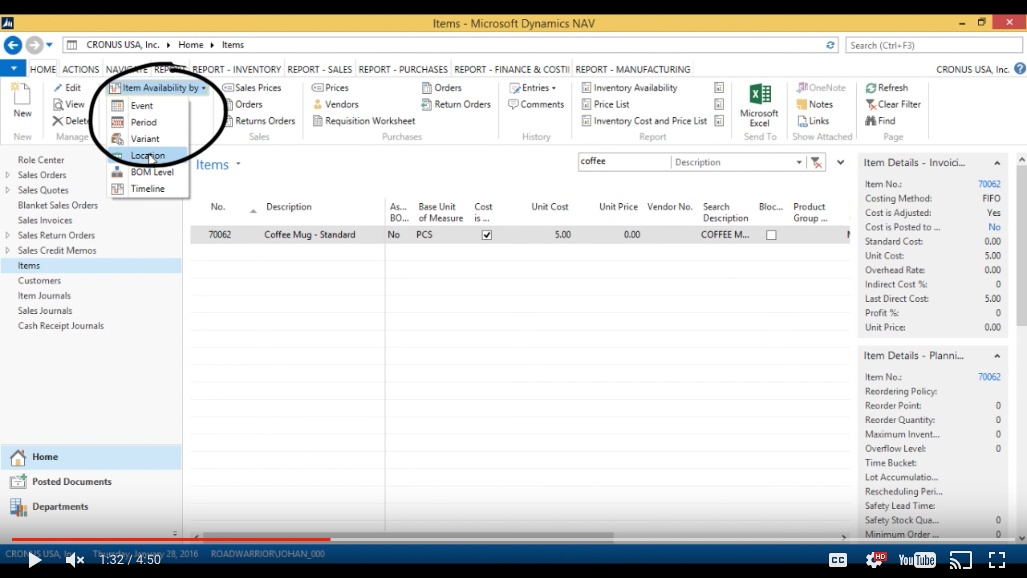
I can then go ahead and take a look at the availability, Item Availability > Location.
(Click image to view larger version)
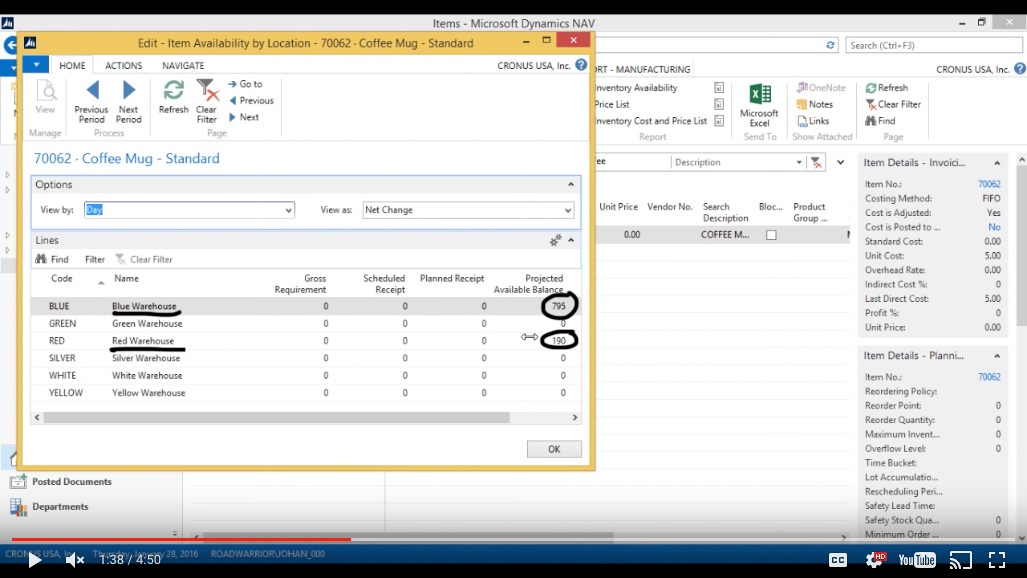
And see that I have 795 in Blue and 190 in Red.
(Click image to view larger version)
Updating the Physical Inventory Count
So I want the people in the warehouse to take a look at that count and record what they find in NAV and update the quantities. So that’s typically what we call a Physical Inventory Count.
I’m going to go ahead and look at the Physical Inventory Journal. Now there are 2 in NAV: the “Warehouse Physical Inventory Journal” and “Physical Inventory Journal”.
View the Physical Inventory Journal
The difference between those two is if you are running full warehouse with bins, then you want to do the “Warehouse Physical Inventory Journal”, otherwise (and in this case) you want to choose the “Physical Inventory Journal”.
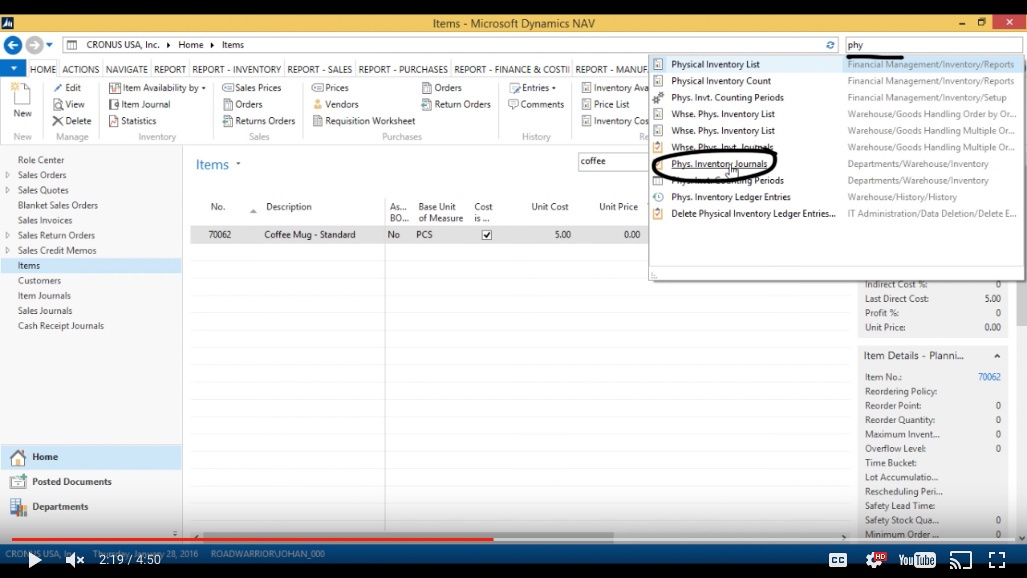
(Click image to view larger version)
Calculate Inventory
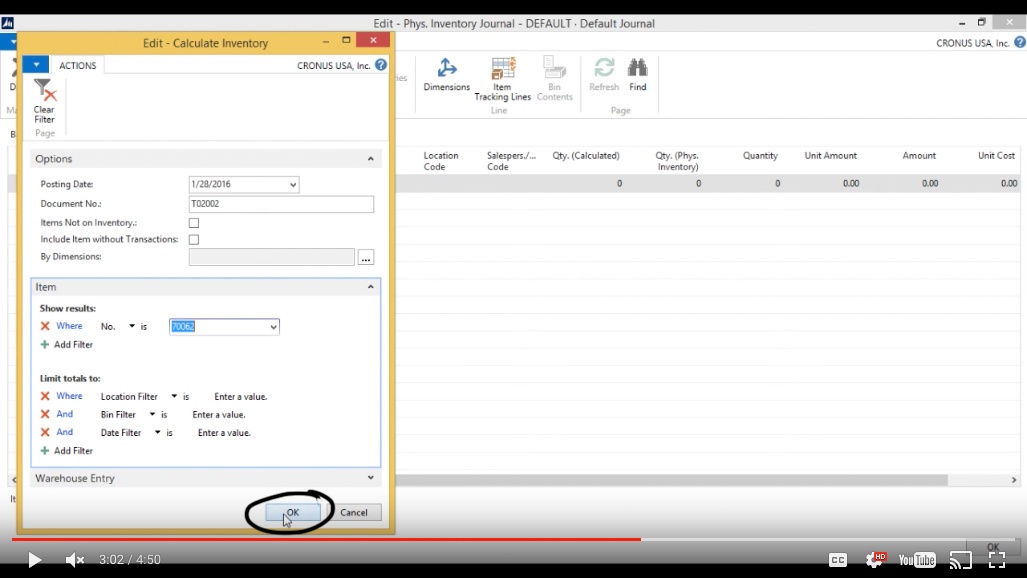
So I’m just going to go right in here and then I want to see how much I have on inventory, so I just hit “Calculate Inventory”.
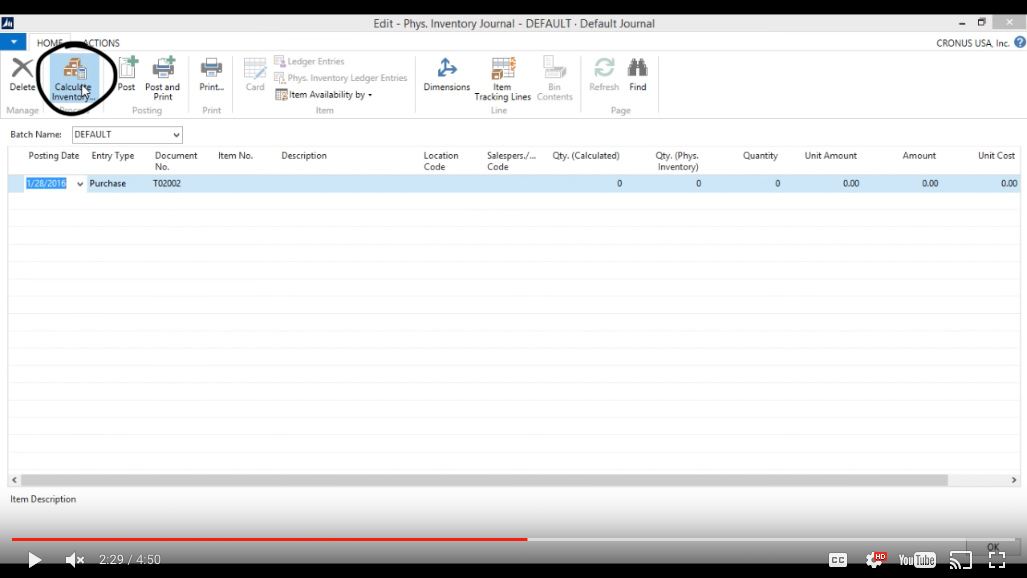
(Click image to view larger version)
That sets up the Physical Inventory Journal for what you want to count. If I don’t put any filters here I’ll get everything in the system, all items; if I only put a certain location, I get it for a certain location.
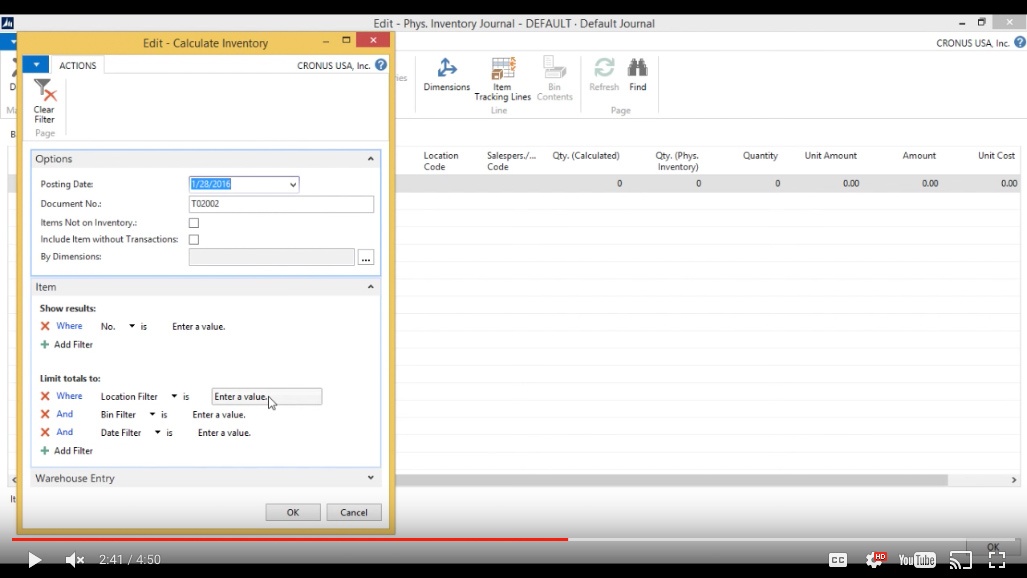
(Click image to view larger version)
In this case I only want to pick the Coffee Mug because that’s what I’m interested in.
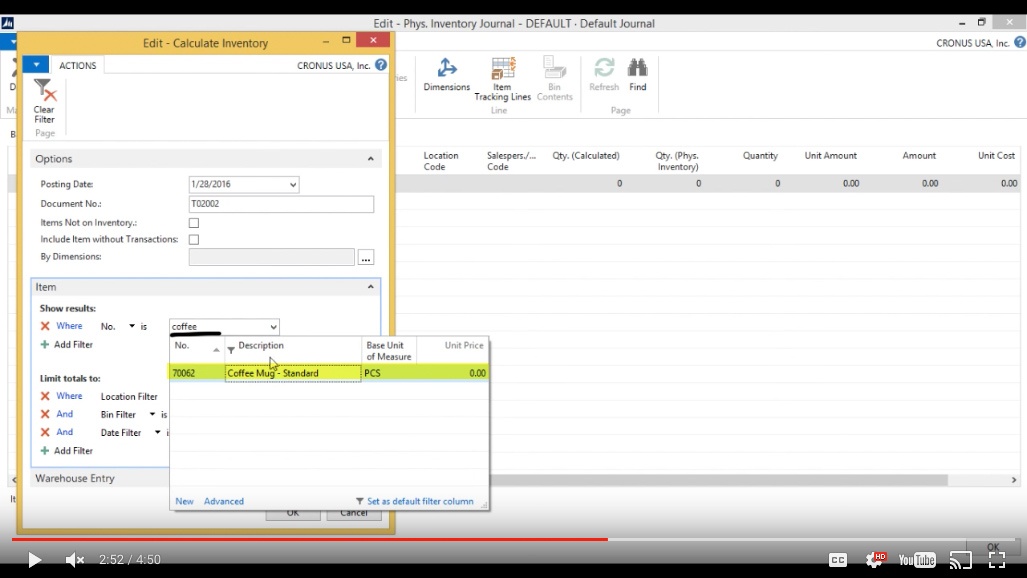
(Click image to view larger version)
I actually want to see that across all locations, so I’m going to send that out to every location to go and count. I just hit “OK”.
(Click image to view larger version)
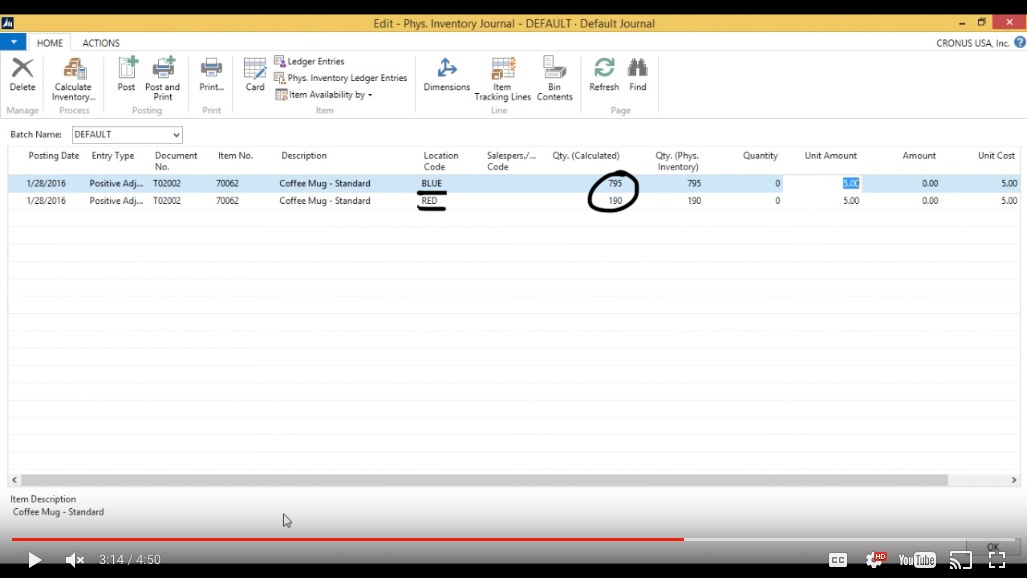
The system thinks you have 795 in the Blue location and 190 in Red.
(Click image to view larger version)
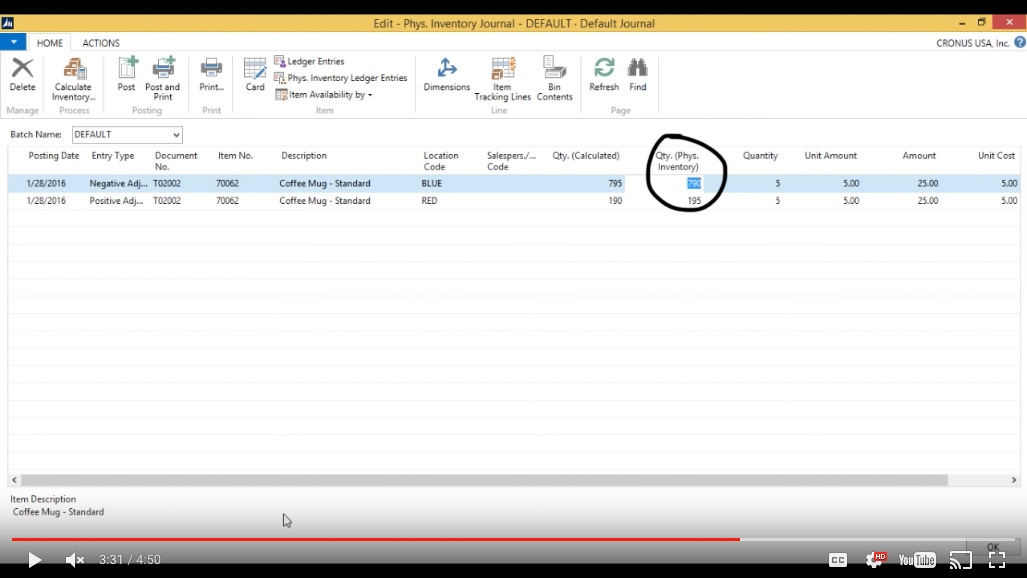
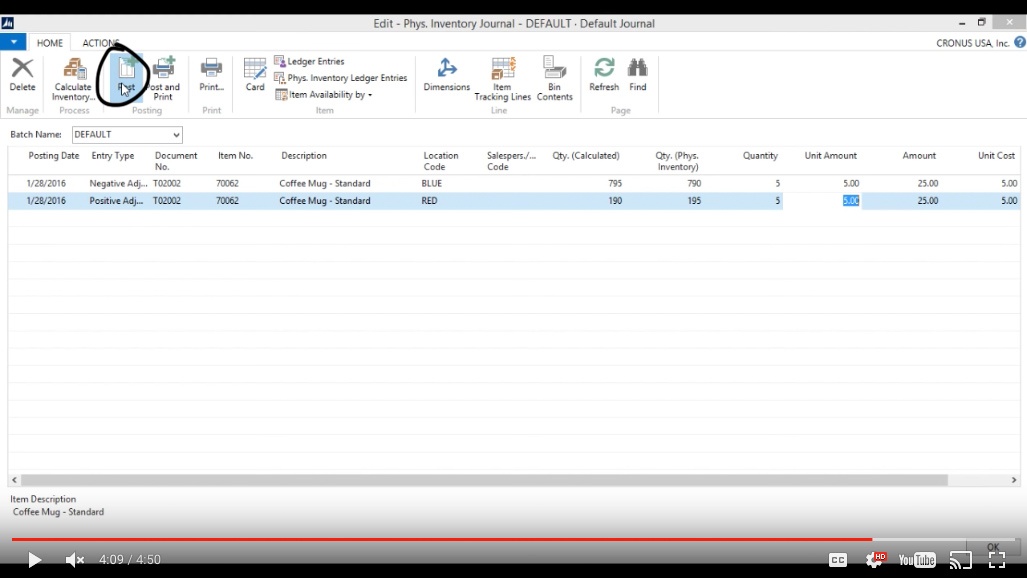
Alright, so they go out and count, and it comes to light that we actually have 790 in the Blue location and 195 in the Red location under the “Qty. Phys. Inventory” column.
(Click image to view larger version)
Positive and Negative Adjustments
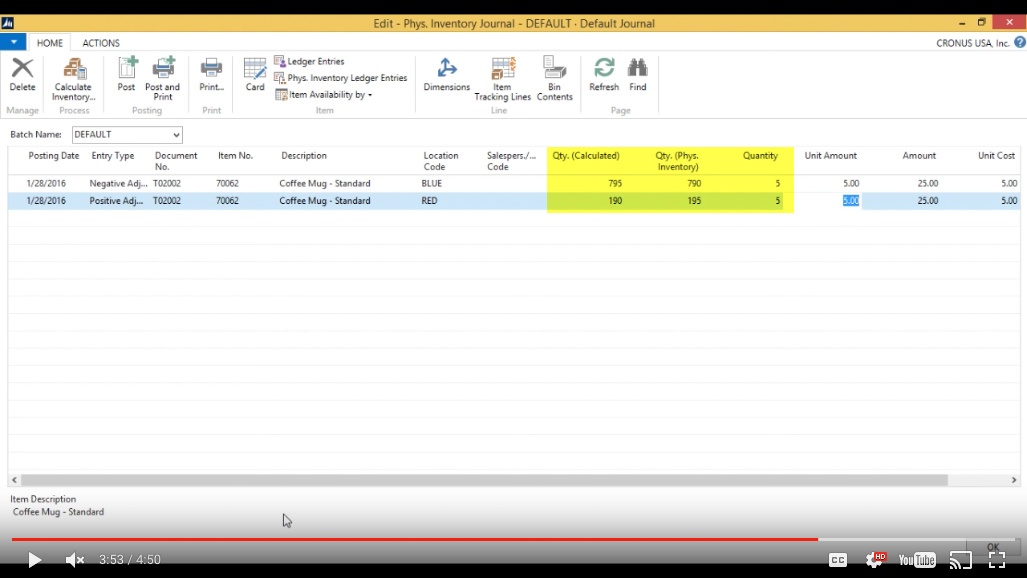
Ok, so basically 5 are misplaced between the locations. And notice that the system automatically puts 5 here, saying that there’s a negative adjustment of 5 that’s supposed to happen in the Blue and then there is a positive adjustment of 5 that has to happen in Red.
(Click image to view larger version)
Ok, so now somebody of course comes and checks this over, and says ‘ok did you really find that many in each location?’ Yes. Alright then, we record it. So we go ahead and hit “Post”.
(Click image to view larger version)
Post
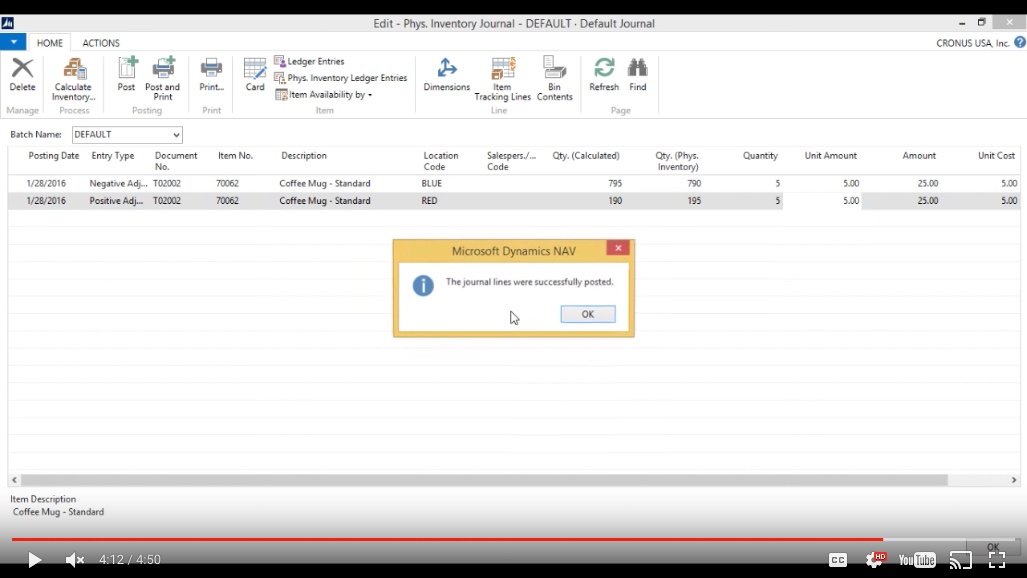
And I post to journal, now it’s successfully posted.
(Click image to view larger version)
Verify Item Availability by Location
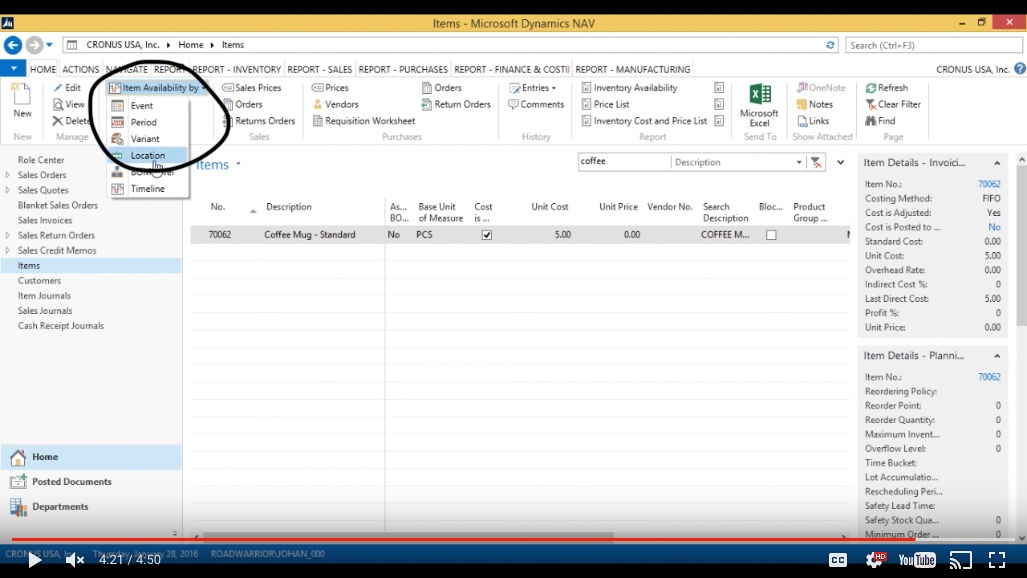
I go back, I look at my item and let’s see the Item Availability by > Location.
(Click image to view larger version)
And now it’s 790 and 195 and my inventory levels have been updated correctly.
You've learned some of the many ways your business can benefit from using inecta Food. It's trusted by other businesses in your industry and can work just as well (or better) for you. inecta Food is easy to implement. It's easy on your budget with monthly subscription payments. Take the next step to ensure your food business is running the right kind of business software. Software for your food safety, increased efficiency, and stronger revenue growth.
Curious about implementation costs, training, getting a customized demo & detailed estimate, booking a discovery call?

Global Headquarters:
225 Broadway #660,
New York, NY 10007
1-800-632-0573
©2023 INECTA LLC
Global Headquarters: 179 Franklin Street, New York, NY 10013
©2020 INECTA LLC