Global Head Office:
225 Broadway #660, New York, NY 10007
Inecta is the only Food ERP you'll ever need. Take a look at additional functionality layered on top of our core software offering.
Broaden your ERP knowledge in more ways than one
We know food and we have your industry covered
BI Reporting
+ Pre-packaged BI reporting that are easy-to-use
+ Real-time actionable insights that are relevant to you
+ Worry-free automatic updates & maintenance
+ Tailored custom BI reporting available upon request
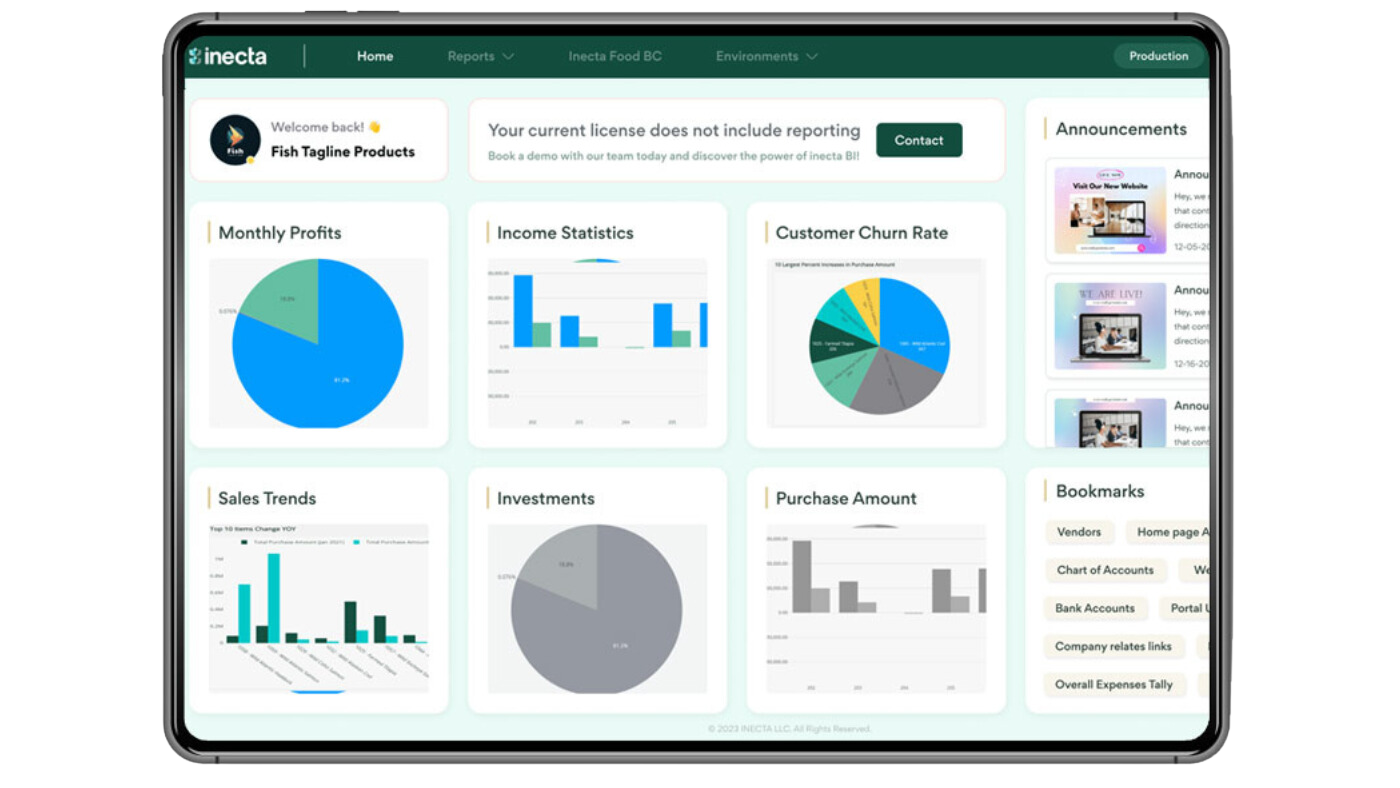
Our intuitive business intelligence reporting on food inventory offers real-time updates, historical data, and predictive data analytics, providing food businesses with the insights they need to optimize business performance and maximize profits.
Our comprehensive business intelligence reporting solution offers historical data, real-time analytics, and data visualizations to help CFOs and controllers manage finance data for multiple companies. With our solution, you can easily identify trends and patterns to make informed decisions that optimize your business operations. Additionally, our user-friendly interface allows you to create custom reports and data visualizations that provide deeper insights into your financial data.
Our business intelligence reporting solution includes standard BI reporting and data analytics tools, allowing you to analyze data such as aged account receivables, customer statements, payment receipts, customer reconciliation, and sales statistics. With our comprehensive BI tools, you can easily generate business intelligence reports and gain valuable insights into your financial data.
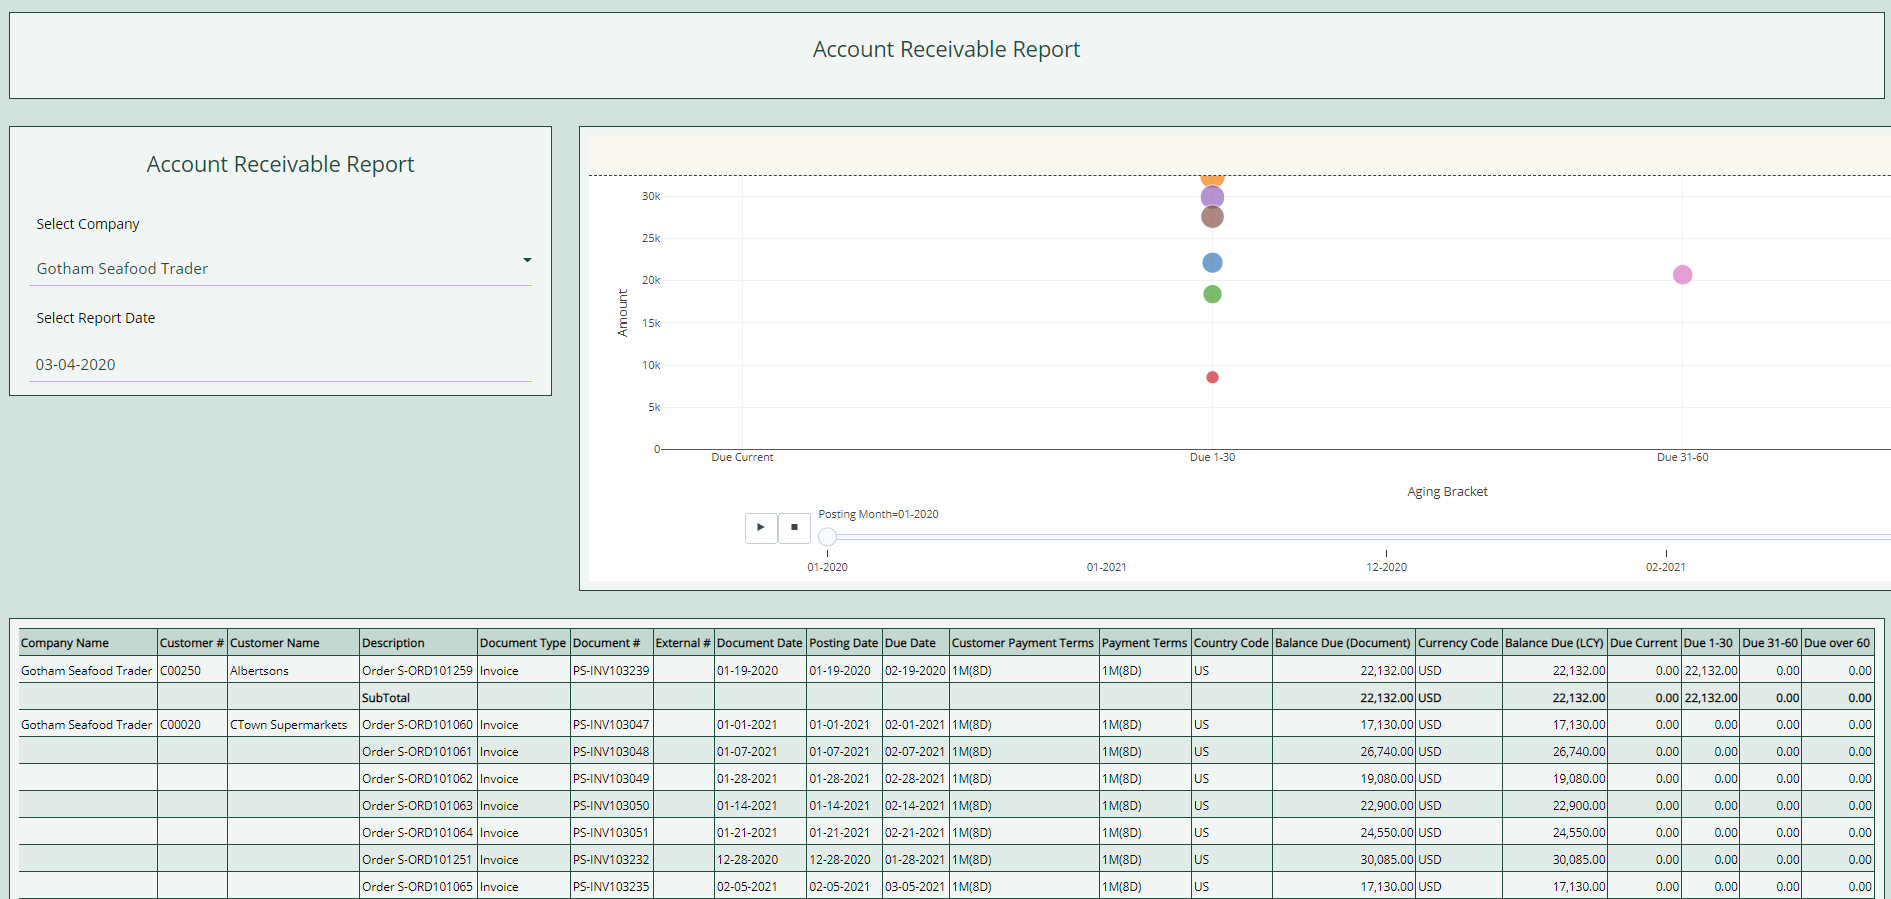
Finance & Accounting Reports
Cash Application
Financial Data Analytics
Account Payables/Receivables
Finance Dashboard
Borrowing Base
Sales & Customer Service BI Reporting
Sales by Item Summary Monthly
Sales History by Customer Summary
Sales Overview
Sales Year-Over-Year
Sales Analysis Map
Profit Analysis (Profit Margin)
Gross Margin Vs Sales by Salesperson
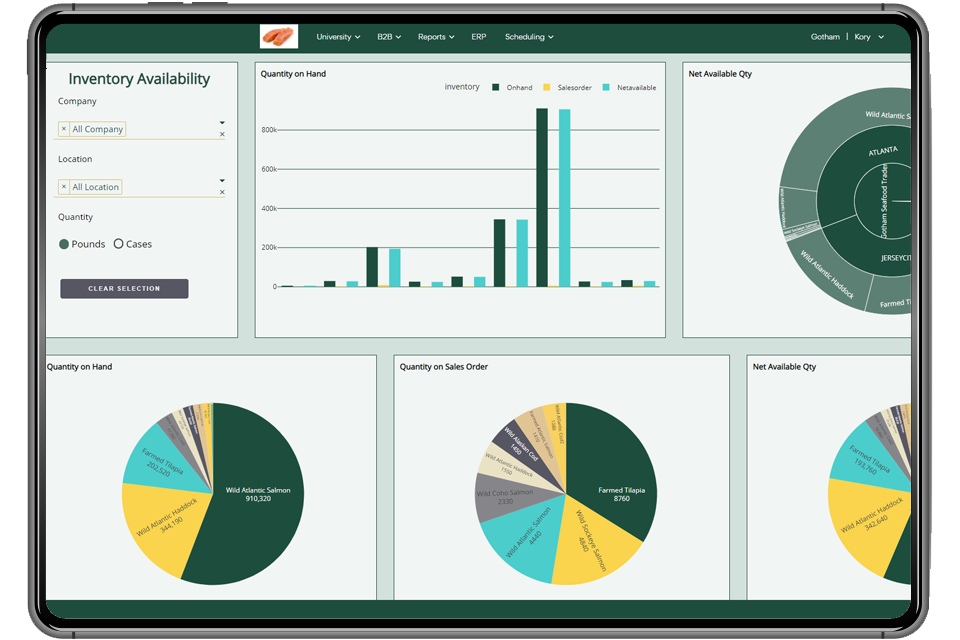
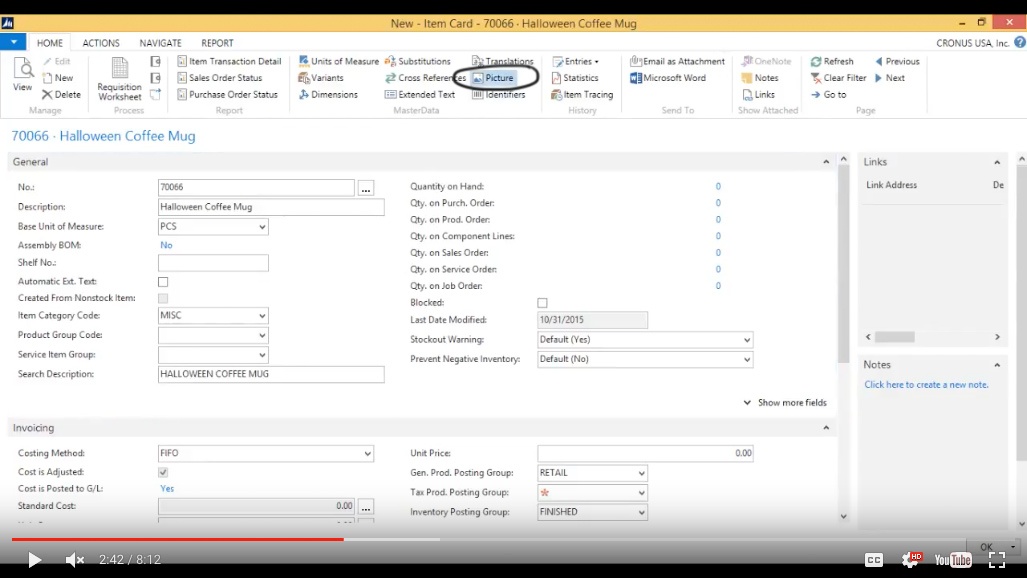
Inventory Management Reports
Inventory Valuation
Inventory by Location Report
Inventory Availability
Inventory Expiration
Inventory Pivot
Inventory Aging
In-Stock Lot Summary by Case
Purchasing & Planning Reports
Purchase
Purchase History by Vendor
Purchases By Item
Vendor Item Statistics
Vessel Management & Fishing Reports
Vessel Status Report
Profit Margin
BI reporting, or Business Intelligence reporting, is the process of collecting, analyzing, and leveraging data in a meaningful way to help businesses make informed decisions. BI reporting tools allow businesses to extract data from multiple sources, such as databases, spreadsheets, and web services, and present it in a way that makes it easy to understand and analyze.
BI reporting can help businesses make better decisions by providing them with real-time insights into their operations from multiple data sources. This can help businesses identify areas of improvement, reduce costs, and increase revenue. BI reporting also allows businesses to track key performance indicators (KPIs) and monitor progress towards goals, which can help improve efficiency and productivity.
There are many BI reporting tools available, including inecta BI, Tableau, Power BI, QlikView, and SAP BusinessObjects. Each tool has its own strengths and weaknesses, and businesses should choose a tool that meets their specific needs and business insights requirements.
To create a BI report, you first need to identify the data you want to analyze and the questions you want to answer. You then need to collect the data from various sources, such as databases, spreadsheets, and web services, and prepare it for analysis. Once the data is ready, you can use a BI reporting tool to create visualizations and reports that provide insights into the data.
Business intelligence reporting can be used in virtually any industry to help businesses make better decisions. For example, in healthcare, BI reporting can be used to analyze patient data and identify trends and patterns that can help improve patient outcomes. In retail, business intelligence reporting can be used to track sales trends and inventory levels, which can help businesses optimize their product offerings and improve profitability.
225 Broadway #660, New York, NY 10007
© 2023 INECTA LLC. All Rights Reserved.